
Day
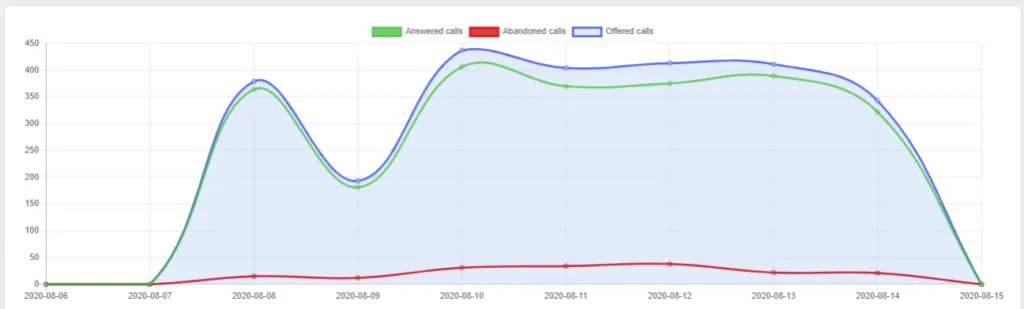
On this report we can get the calls offered (calls that entered the Queue), Answered Calls, and Abandoned calls totaled for the day.
We can also see a table below the graph with the following information:
-
Day, Date to show the information from.
-
Offered Calls, total number of calls that entered Queue.
-
Answered Calls, total number of calls answered by the agents.
-
Abandoned Calls, total number of calls not tended to, and left the Queue.
-
Answered Calls %, percentage of calls answered with repect to the calls that entered Queue.
-
Avg Call Time, average call time of answered calls.
-
Min Call Time, minimum duration of the answered calls.
-
Max Call Time, maximum duration of the answered calls.
-
Avg Call Wait Time, average Call Wait Time for all the calls.
-
Min Call Wait Time, minimum Call Wait Time for all the calls.
-
Max Call Wait Time, maximum Call Wait Time for all the calls.
-
Abandoned Calls %, percentage of the abandoned calls.
-
Avg Abandoned Call Wait Time, average Call Wait Time duration of abandoned calls.
-
Min Abandoned Call Wait Time, minimum Call Wait Time when a call is abandoned.
-
Max Abandoned Call Wait Time, maximum Call Wait Time when a call is abandoned.
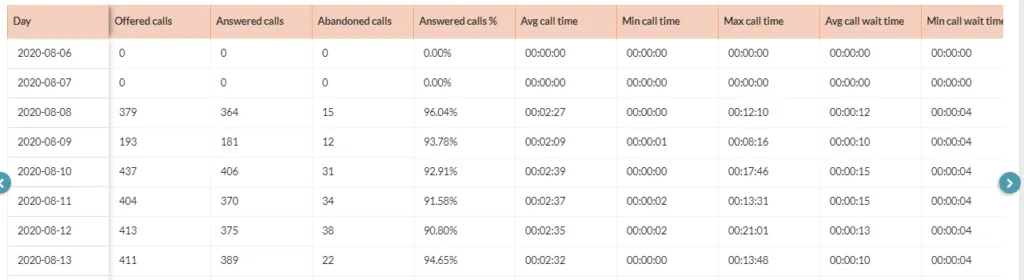
On every table where there is a lot of information to show, you will find a pair of arrows indicating there is more information to either side.
Was this article helpful?
Your feedback helps us improve the documentation.
Thank you for helping us improve!